As with all good designs, the most important factor in the process is you the design artist…
There is a finite set of UI components, colour palettes, fonts, layout frameworks and design techniques available for designing a user interface (UI). So, the art form is defined by your ability to utilise the elements at your disposal and create a pleasing and unique visual result.
Interface Screen Shot Examples in this Article
Throughout this article I will showcase a series of screen shots from some real product designs from my work portfolio that I have created over the years.
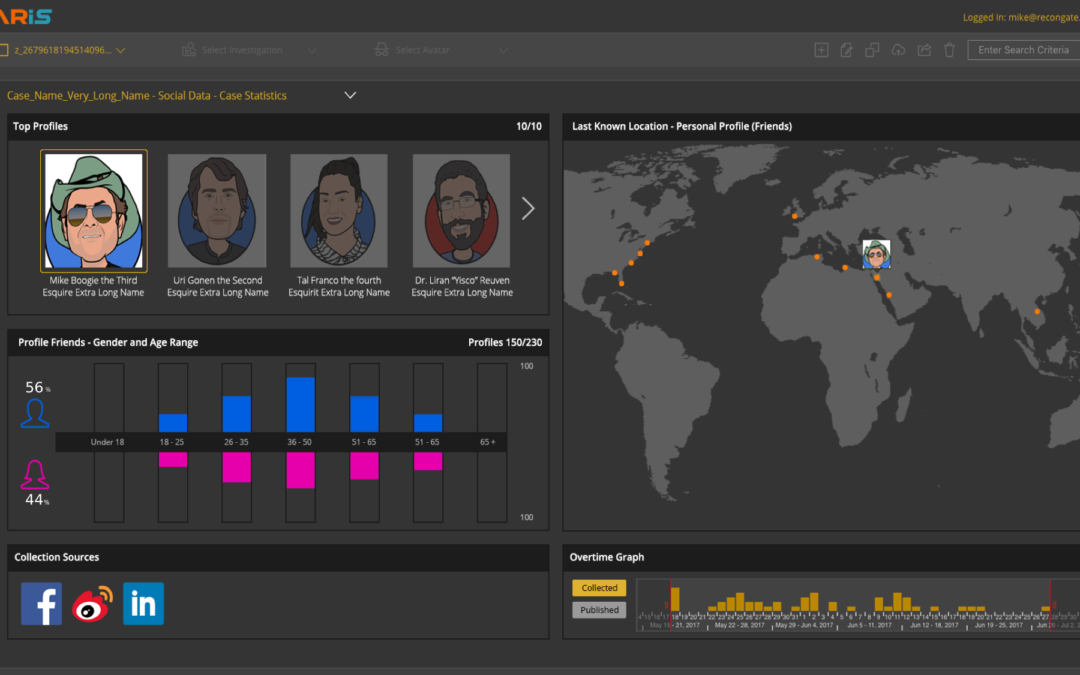
- The first product UI – I reference is a product called “Varis” and its main design focus is for collecting, analysing and displaying published textual and visual data from the web and the datas inherent relationship.
- The second product UI – Is a design that I showcase is for an “HPE Server” and it shows the “first time user setup and configuration” flow for an HP CS200 Server installation.
The First Product Scope Description
In order to understand the UI designs that I will showcase in this article, I have provided a brief and “simplified” set of “product objectives” and typical “use case” scenarios to help you understand why design decisions were made.
Overview – The scope of the first product “Varis” is a web intelligence investigation tool for collecting, mapping, analysing and deciphering the textual and visual data collected from the web. The tool must also display the relationships and interconnectivity of the people who write the posts and comments collected.
Varis – Product Design Requirements
The objective of the proposed product – To enable an analyst to collect published web content by authors from all available web sources (Surface/Deep/Dark Web) and then display the collected content in a unified set of distinctive views that differ according to the data types collected. Once collected, the relevant KPI’s are extracted from the data to provide the user with the various understandings and points of view.
General Data Collection
The collected data must include the following content items – articles, posts, comments, images: These items must include:-
- The author and photograph (if available)
- The date of publication and collection.
- The associated posts and comments.
- Display the relationships and interconnectivity of the people who write the posts and comments.
- Show as many data points that are available for the specific data elements collected.
Additional Required Machine Learning and AI Functionality
In addition, the product must also provide machine learning capabilities for improving the analysts ability to focus their search overtime, based on object selection and usage.
The solution must provide textual sentiment analysis and image recognition abilities.as well as display the relationships between content authors and people who comment, share or interact with content in any way.
Product Use Case Workflow
An analyst performs a search by using either a keyword/s or a complex search query for detecting, collecting and displaying online content written (uploaded) by targeted individuals.

This content includes images, article, posts, comments as well as the authors, time , origin, publication date, and comments and their inherent author details. The potential target search environments included are the surface/deep and dark web spheres, news sites, forums, blogs, social media and chat groups.

Product Content Display and Manipulation
The collected content data is displayed in a verity of views and interconnected topological graphs. The objective of these views is to show the different relationships and connections between the content data authors. Then multiple dashboard KPI’s are created by extrapolating data points and content from the different collections.

The analyst then uses the powerful built-in search and query mechanism to manage the collected data and view different relationships and correlations between elements. The relevant understandings and conclusions are drawn and can be recorded into the system for further investigation.
The displayed views highlight the data according to the customer requirements.
Product Architectural Blueprint
The functional architecture and user experience for this product are based on the product requirements that were defined by interacting with customers and users.
Pixel Accurate UI Designs
I started the project by interviewing multiple stakeholders. Once I had reached a critical mass of knowledge that I deemed enough to provide me with a rudimentary understanding of both the product requirements and user necessities I built a “Pixel Accurate” screen shot deck.
The screenshots that appear in this article are a selection from the original “product functional deck” that were leveraged throughout the development process.

Conclusion
The ability to design an amazing and unique product fall somewhere between artistic skill and exact science. Often stakeholders in the food chain such as software/QA engineers and product managers incorrectly assume that designing a software product interface is just an abstract art form.
That couldn’t be further from the truth. Designing a unique software product is most certainly an exact science that leverages artistic skill and creativity to make something new from the finite set of standard UI components that are available to the designer and front-end developer.
Go to the Original Article
Related Articles
I have utilised various techniques to build my product solutions, such as product strategy, design techniques and agile methodologies described throughout a series of related articles.
If you wish to expand you knowledge on some of these topics use the following links to learn more about how to understand, plan and execute a product strategy for your company.
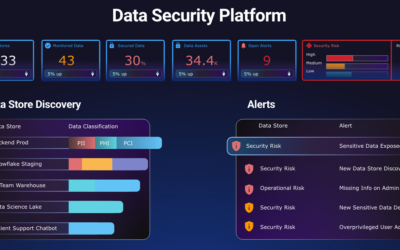
How to Design a Product Dashboard
A product dashboard is a single pane of glass where users can visually track a products KPIs (Key Performance Indicators). The dashboard allows users to monitor the health of a business, analyze processes and access actionable insights. A dashboard provides a...
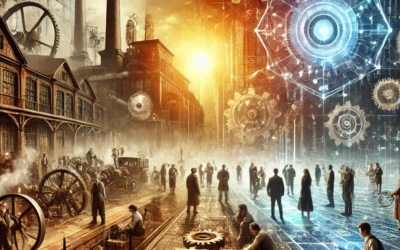
The Industrial Revolution & User Experience
The industrial revolutions have reshaped the fabric of human civilization, pushing the boundaries of innovation that have redefined every aspect of our lives. From the mechanization of the first industrial revolution to the digital age, each transformation has not...
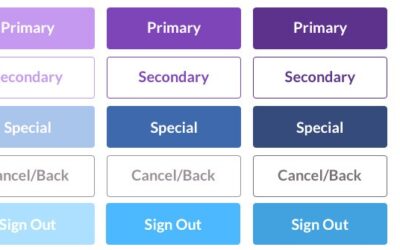
UI Component Types
The objective of each UI component is to facilitate a specific task, enhance the design efficiency and provide user satisfaction. The user interface elements also include the page and screen dimensions as the starting point which define the user interface real estate....
Recent Comments